A healthy mind in a healthy body
Health departments recommend a healthy diet for good health and well-being. However, we all know that “comfort food” (burgers, cookies, …), although being unhealthy, makes one feel good. Therefore, the following questions arise: Is eating healthy really essential to well-being? What is the influence of a food or nutrient on one’s mental health? Is there a specific nutrient that makes one happy?
Let’s find out!

Healthy diet definition
First, we need to define what a healthy diet is. There are plenty of websites, videos and articles on healthy diets. Among the various sources, we decided to use two different definitions of the composition of a healthy diet:
-
Wikipedia 1 , because it is a popular website on which many people look for information. Thus, people might take it as a reliable source towards healthy eating.
-
US Food and Drug Administration (FDA) 2 , an official source with scientific background.
The FDA updated their recommendations in March 2020. We decided to take both the original and the updated one to distinguish if one yields better results.
Both websites state recommendations for daily nutrients intake. The Wikipedia article focuses on fruits, vegetables, grains, dairy, red meat, poultry, eggs and fish while the FDA one focuses on fat, fibre, carb, protein and saturated fats.
Each definition gave us a pipeline to follow to eat healthy.
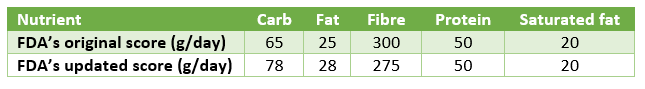

The healthy scores were then computed as follows :

Where healthy portion is given by Wikipedia or the FDA and Fnutrient is the fraction of nutrient of the average product per area.
The higher the score, the healthier the area eats.
Are food and well-being correlated ?
First, let’s compute the Spearman rank coefficient between the different nutrients as well as the Wikipedia score and the well-being of London residents.
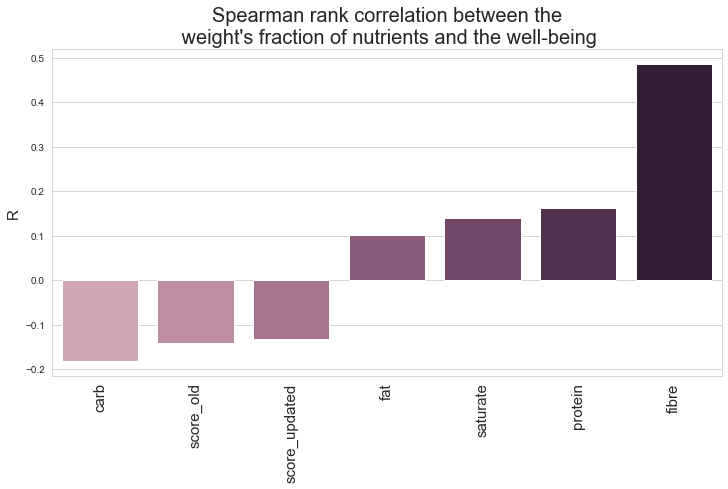
The nutrient with the highest correlation coefficient is the fibre. It is surprising to see that both FDA scores are negatively correlated with the well-being.
Then, let’s plot the Spearman rank correlation between the different types of food and the well-being of London residents.
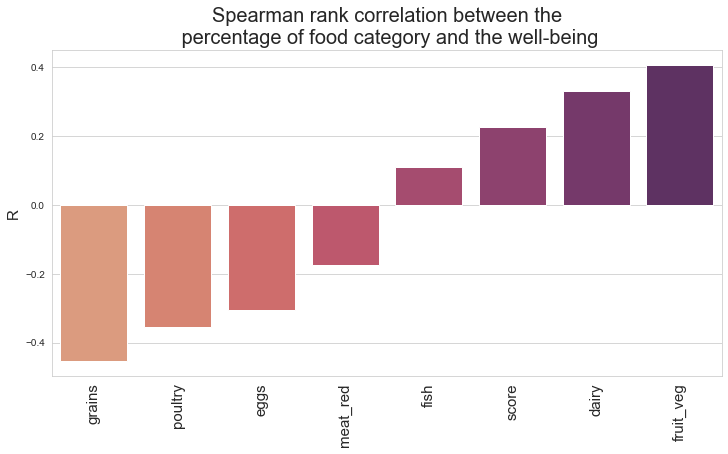
Here, the food with the highest positive correlation with well being are fruits and vegetables. It makes sense, as most health offices recommend eating plenty of fruits and vegetables. On the other hand, grains are negatively correlated.
As vegetables and fruits are rich in fiber, it seems that both scores agree. However, whole grains are also a great source of fiber while grains are negatively correlated with well-being. This might be due to the fact that most Londoners eat more refined grains.
The Wikipedia score is positively correlated with the well-being.
All nutrients and foods used are statistically significant predictors of well-being according to the Spearman rank correlation because the t-test p-value against the null hypothesis that the coefficient is equal to 0 is lower than 0.05.
Can we predict happiness with our healthy scores?
Let’s try to predict well-being by fitting an ordinary least squares regression to nutrients as well as foods, FDA and Wikipedia scores.
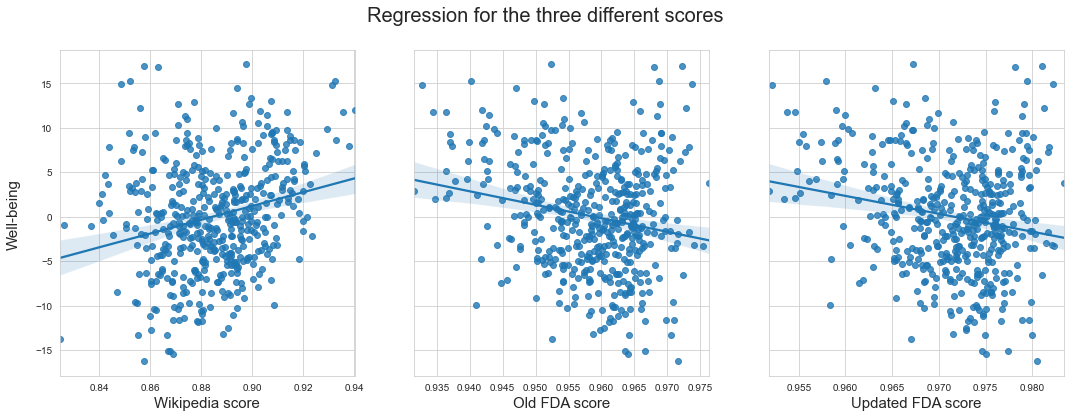
Unfortunately, it seems like our healthy scores cannot predict well-being. The regressions tried to capture a trend but the datapoints don’t seems to have one.
We performed a regression to predict well-being using different types of food. The statistically significant coefficient value are shown on the figure below.
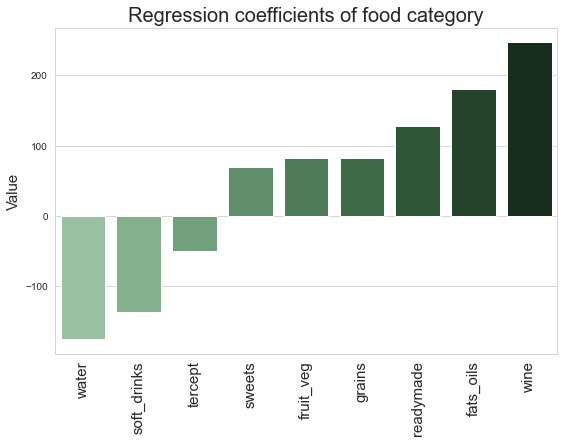
The result is surprising: apparently drinking water lowers your well-being whereas drinking wine makes you happier!
Can we classify happiness and unhappiness according to food intake?
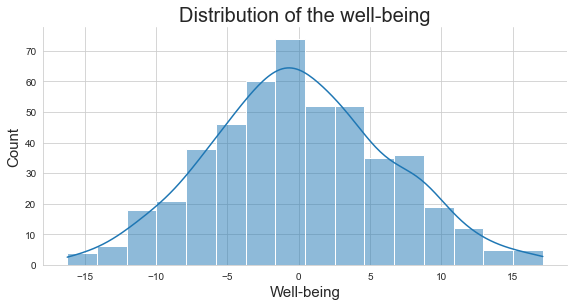
Having a look at the distribution of the well-being, we thought of classifying areas into happy (well-being ≥ 0 ) and unhappy (well-being < 0 ) region.
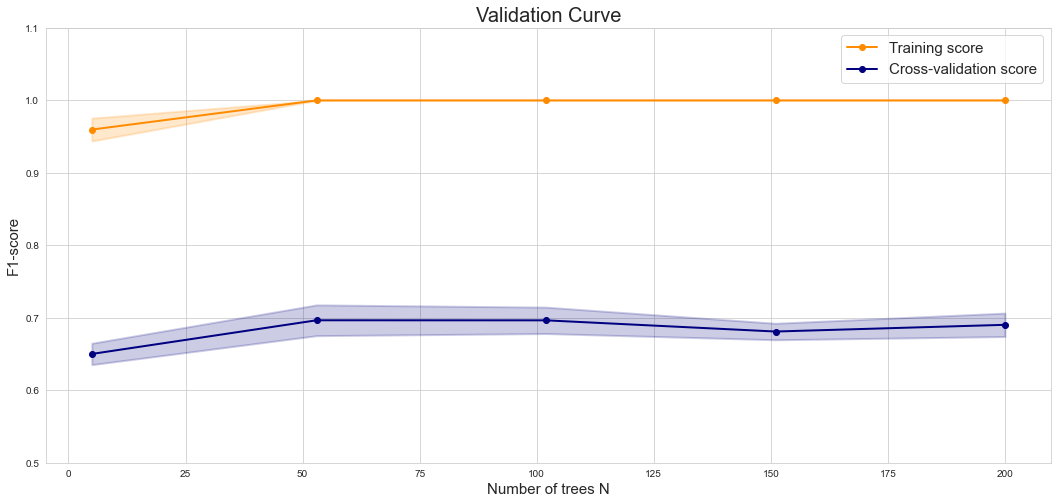
We trained a random forest classifier. The figure below shows that the model performs moderately well on the test set and is highly overfitting.
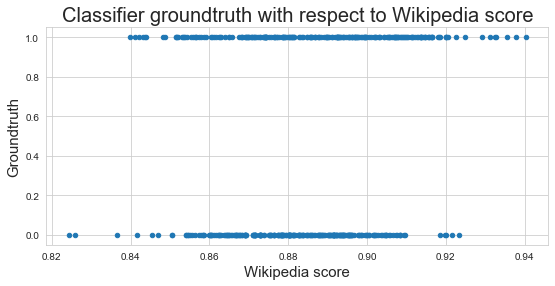
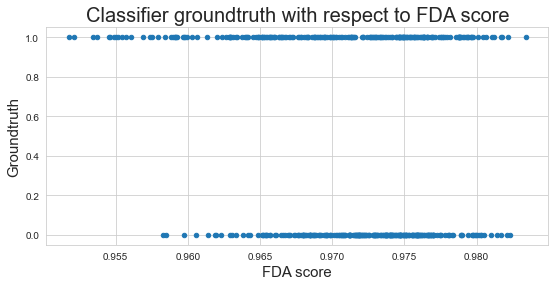
However, when plotting the classes as a function of scores, we can clearly see that these scores cannot predict happiness because there is no tendency that would allow to classify the datapoints correctly.
What have we learned?
Happiness is a complex notion ruled by a large variety of factors and food consumption is only one of them. Results of our research follow this intuition.
Food consumption only explains one aspect of human well-being. Indeed, we would need more indicators such as wealth or crime rate. Moreover, the indicators we used in our analysis did not take into account all types of food (such as oils, alcohol,…). Some data could be added such as average vitamins per product and other nutrients in order to conduct more analyses. Moreover our computation of scores might not be optimal. Indeed, with the MSE formula, not eating a certain nutrient is equally bad as eating the double of the recommended portion. This might not reflect real life mechanisms.
Some fun experiments could be realised to better understand the link between well-being and food consumption. For example, with the help of volunteers, some London residents could change their diet towards another area’s diet and see how their happiness changes.

Bon Appétit! And don't forget to drink wine and eat brownies !